Northern parks enter both typhoon and flood screening. The 9/13 figure is all nodes above their own reference line, shown above.
00 / HOW TO READ
Start with the decision question, then choose the evidence chain
When reading the report, start with the decision question. To ask “where would another Yagi disrupt first”, use the event replay. To ask “which park should be upgraded first by 2040, and at what NPV”, use the scenario stress test. To ask “when will power, water and heat pressure appear in the next 6–12 months”, use the ENSO watch. The three outputs answer different questions and are not additive; every chart is labelled with its evidence chain.
Another Yagi tomorrow: where does disruption start?
We use the IBTrACS track (SID 2024244N09137, 57 points, maximum track wind 136 kn) and the H08 wind field to reconstruct peak wind on a 0.05° northern-Vietnam grid and at 13 nodes. We then apply a USD 100m standard asset and a regional typhoon vulnerability curve to estimate a single-event screening loss.
Use: calibrate thresholds, exposure and single-event order of magnitude. Not extrapolated as a future pathway and not included in AAL.
Past data: IBTrACS; park areas and tenants from VSIP, DEEP C, Amata and LEGO official pages plus OSM; 2023 curtailment from Reuters and Tuoi Tre. Source-by-source detail is in 08 Data.
By 2040: which park should be upgraded first?
Future loss is not extrapolated from the Yagi track. Typhoon uses CLIMADA 10synth tracks for RCP8.5/2040 (main) and RCP4.5/2040 (control). Flood uses the river_flood 150 arcsec RCP8.5 main case and an RCP2.6 low-case envelope; that CLIMADA set has no RCP4.5 flood layer.
H08 converts tracks into a 0.05° wind field. Damage ratios come from the Eberenz et al. (2021) South East Asia typhoon curve and the report's five-point flood assumption. AAL = event frequency × damage ratio × standard asset.
Use: rank and stress-test under one asset basis. The 2040 number is not a certain loss; it is an annualised indicator under that scenario.
Next 6–12 months: when do power, water and heat pressure arrive?
Using NOAA CPC (8 Oct 2026), WMO (Oct 2026), UNICEF Viet Nam SitRep 2 (12 Oct 2026) and Vietnam News (Jul 2026), we list the intensity, persistence probability and Vietnam impact windows for 2026–27 El Niño.
Use: flag the timing of heat, low rainfall, salinity intrusion and water/power stress. Not included in RCP8.5/2040, not converted to AAL, and never added to the long-term scenario.
ENSO does not cancel typhoon risk: seasonal statistics may favour fewer or later storms, but a single strong typhoon, extreme rainfall and waterlogging still require separate assessment.
Disclaimer: This is screening-level decision support, not a weather forecast, loss prediction, insurance price, engineering feasibility study or investment advice. Assets are a USD 100m standard value, not client book value. Parks are represented by the nearest grid point; the flood curve is not calibrated to site elevation, drainage or flood defences. ENSO is a near-term watch layer only. Any capex, siting or insurance decision should be based on site verification, independent due diligence and formal engineering assessment.
Method and data: data sources and basis · loss and AAL method · source log. All tables and documents are in 08 Data and sources.
01 / EVENT REPLAY
Yagi replay: exposure screening under a common wind field and node thresholds
In September 2024, Yagi crossed northern Vietnam. Reconstructed with IBTrACS tracks and the H08 wind field, 9 of 13 nodes exceed their own reference line (parks/land 32.7 m/s, ports 24.5 m/s); four northern parks enter both typhoon and flood screening. The thresholds are report assumptions, not Vietnamese statutory standards.
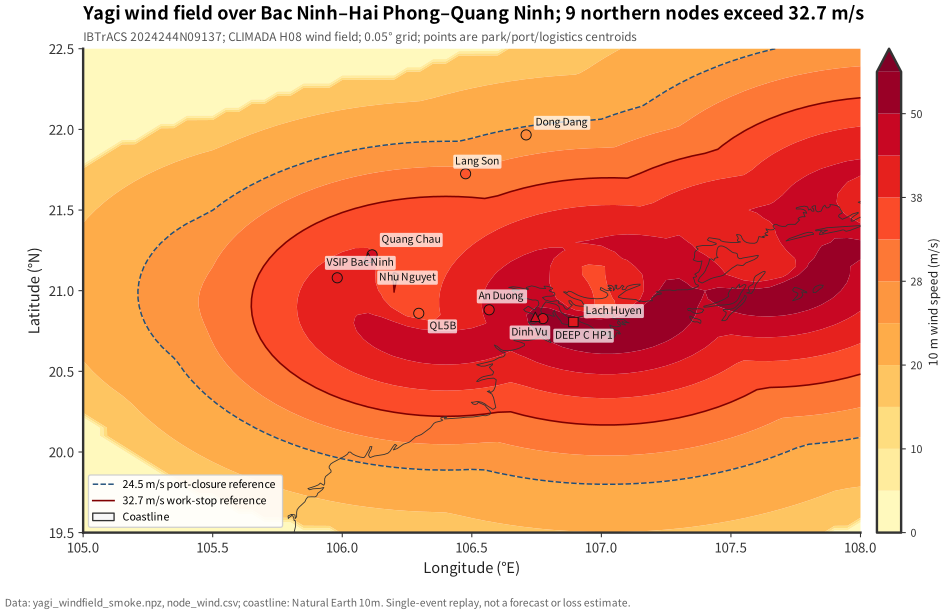
Terms: wind field = H08 converts track maximum wind and radii into a 0.05° grid; node value = nearest grid point, not a park-boundary maximum.
Source and nature: IBTrACS observed track + CLIMADA H08 model wind; A15. See assumptions.
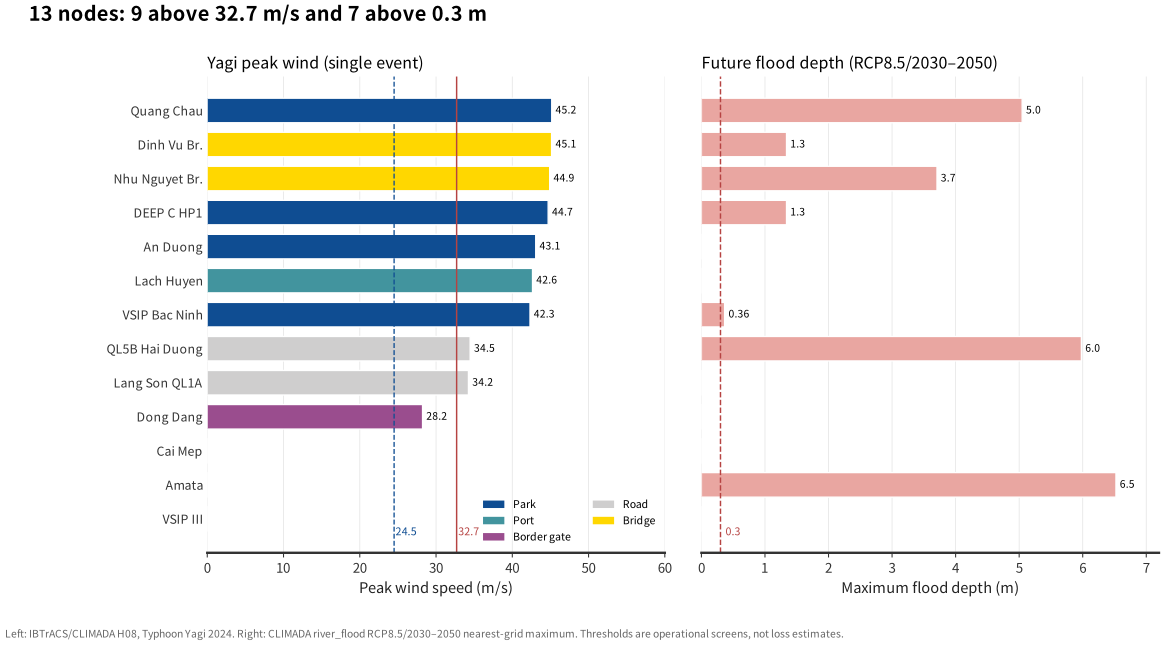
Terms: peak wind = maximum along the track; maximum depth = node maximum in the RCP8.5/2030–2050 event set; point depth is not park inundation.
Source and nature: wind is modelled (IBTrACS + H08); depth is modelled (CLIMADA river_flood); thresholds and closure rules are assumptions; A02–A04, A09–A10, A14.
Single-event screening: ≈$33.4M
Four northern parks, USD 100m standard asset and the South East Asia typhoon curve. This is an upper bound “if all assets are exposed and the curve applies”, not an insurance loss estimate.
Largest single park: Quang Chau $9.9M, DEEP C $9.3M, An Duong $7.5M, VSIP Bac Ninh $6.7M.
Why not “wind × asset”
- Wind is mapped through a calibrated regional impact function, not a linear multiplier.
- Flood uses a five-point 0 / 0.5 / 1 / 2 / 3 m curve; it is a screening assumption, not site-calibrated.
- Single-event loss and AAL are separate metrics; they are not additive and are not an annual budget.
| Time | Event / scenario | Use in this report | Boundary |
|---|---|---|---|
| 2023-05/06 | Rotating power cuts in northern Vietnam (public reporting) | Regional context for the 1–5 power score | No power-system simulation; not converted to AAL |
| 2024-09 | YAGI (Yagi) crosses northern Vietnam | Event replay, node threshold screening, single-event loss upper bound | 57 track points; maximum track wind 136 kn; not a “maximum possible event” |
| 2026-10 | NOAA/WMO ENSO monitoring and forecast | Near-term watch, impact windows, operational triggers | Not in RCP8.5/2040; not monetised |
| 2040 / 2030–2050 | RCP8.5 main, RCP4.5 control, RCP2.6 flood low case | Scenario inputs for AAL and ROI | Scenarios are not forecasts; the flood set has no RCP4.5 |
Section takeaway
- Judgment: 9 of 13 nodes exceed their own reference line (parks/land 32.7 m/s, ports 24.5 m/s); four northern parks are exposed to both typhoon and flood. The Yagi single-event screening upper bound is about $33.4M, conditional on full asset exposure and curve applicability.
- Evidence: 57 IBTrACS track points, H08 0.05° wind field, the regional typhoon curve and a USD 100m standard asset. Thresholds and closure days are report assumptions, not Vietnamese statutory rules.
- Action: run a wind–rain–port exercise at the four northern parks; write the 32.7 m/s stop-work, 24.5 m/s port-closure and 0.3 m restriction lines into SOPs and lease annexes. Keep manual review near thresholds; do not treat a threshold as an automatic shutdown.
- Triggers to revisit: park-boundary maximum wind, actual closure rules or asset distribution would change the ranking. The $33.4M figure is not annual loss and is not a future pathway.
01b / NEAR-TERM WATCH
2026–27 El Niño: intensity forecast and Vietnam impact windows
As of 8 October 2026, NOAA CPC has an El Niño Advisory; WMO forecasts a 2026/27 OND (Oct–Dec) Niño-3.4 seasonal mean of +3.7°C. The report uses ENSO only as a near-term watch layer: impact windows and business triggers, not a loss conversion and not an addition to RCP8.5/2040.
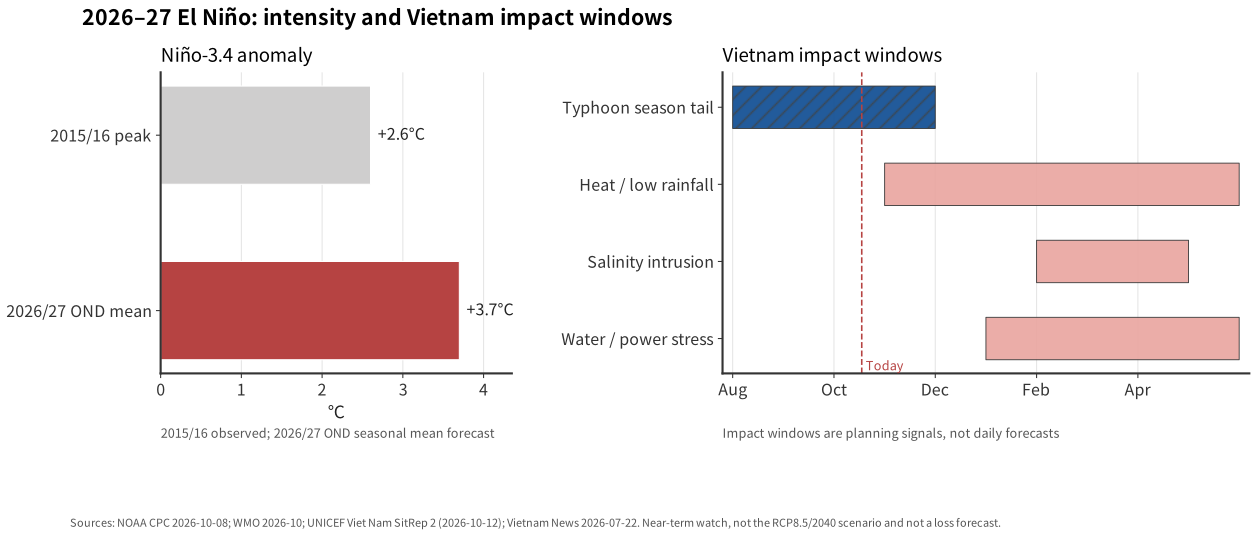
Terms: ENSO = El Niño–Southern Oscillation; Niño-3.4 = central/eastern equatorial Pacific SST anomaly; OND = Oct–Dec; JFM = Jan–Mar. Impact windows are planning signals, not daily forecasts, and do not enter AAL.
Source and nature: observations, seasonal forecasts and report interpretation from NOAA CPC, WMO, UNICEF Viet Nam and Vietnam News; A11.
What this means for tenants
For a customer building or operating in a park, the near-term window can show up as production interruption (power, water, heat), higher operating cost (backup power, cooling, water treatment) and delivery or contract pressure (port closure, road closure, inventory). Whether it happens, and how severe it is, depends on park location, grid, water source and the tenant's own facilities.
DEEP C, VSIP Bac Ninh, Quang Chau, An Duong
What you may experience: curtailment or voltage swings, water-intake limits, raw-water quality changes. Continuous process, cleanrooms and cold storage are most exposed; diesel backup adds cost and fuel-storage constraints.
Ask before signing: independent dual feed, backup hours, 2023 curtailment record, water-source redundancy and priority allocation.
Cooling load and yield
What you may experience: hotter dry-season days raise cooling and process loads, compress equipment margin and can move yield in electronics, precision manufacturing and food processing.
Ask before signing: design temperature for a 2027-type heatwave, chiller redundancy, backup cooling and a yield-risk plan.
Lạch Huyện, Cái Mép, Friendship Pass, QL5B, Đình Vũ
What you may experience: a statistically quieter season does not remove one strong typhoon. Port closure, bridge wind closure, yard damage and delayed labour can hit inbound materials before production.
Ask before signing: closure notice, inventory weeks, alternative route and force-majeure wording.
Amata, VSIP III
What you may experience: low river flow, salinity intrusion and intake restrictions in the late dry season; water treatment cost and production limits can rise.
Ask before signing: raw-water source, storage days, salinity tolerance, treatment capacity and allocation priority.
Section takeaway
- Judgment: 2026–27 El Niño is a near-term stress window, concentrated in January–May 2027; its main business channels are power/water, heat and the typhoon-season tail, not a lower annual typhoon loss.
- Evidence: NOAA CPC, WMO, UNICEF Viet Nam SitRep 2 and Vietnam News; these are observations or seasonal forecasts, not a site-specific forecast.
- Action: complete a power and water stress test by January 2027: confirm dual feed and backup hours, storage/backup water, salinity tolerance and a heat-wave operating plan. Do not cut typhoon preparation because the season may be quieter.
- Triggers to revisit: a revised ENSO forecast, actual reservoir inflow, a new curtailment notice or a change in water allocation.
02 / PARKS
Flood AAL ranks DEEP C and Amata highest; power scores flag Bac Ninh and Bac Giang
Six parks are scored on five dimensions with a within-column 0–100 index. AAL covers typhoon and flood only; power is not monetised. Hai Phong and Dong Nai have the highest flood AAL, but both are driven by the nearest river-grid point; verify site elevation and drainage before using them for capex ranking.
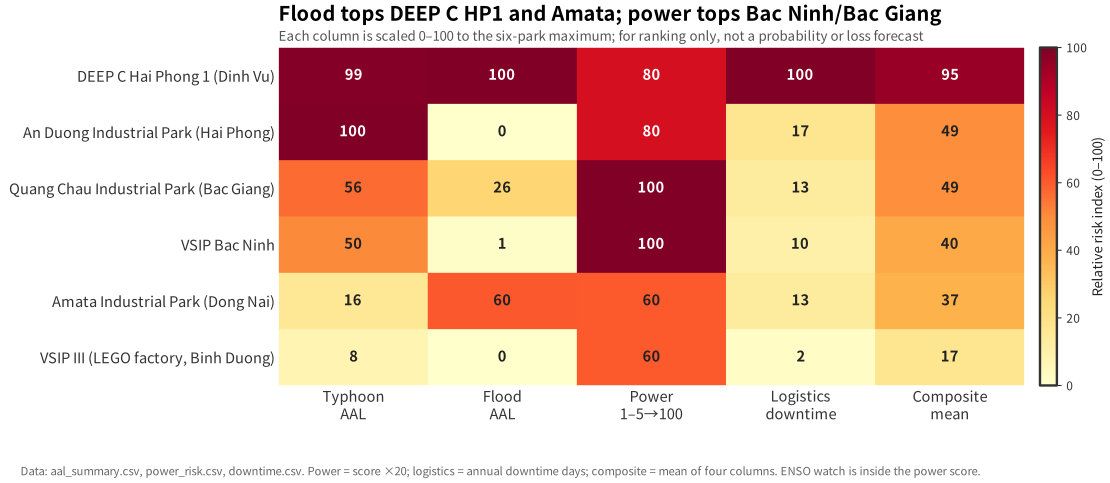
Terms: AAL = frequency-weighted annual loss; index = within-column 0–100 position, not probability; power = 1–5 rubric; ENSO = watch item.
Source and nature: AAL is model output (CLIMADA + Eberenz 2021); asset is a report assumption; power is a rubric; A01, A06–A08, A12.
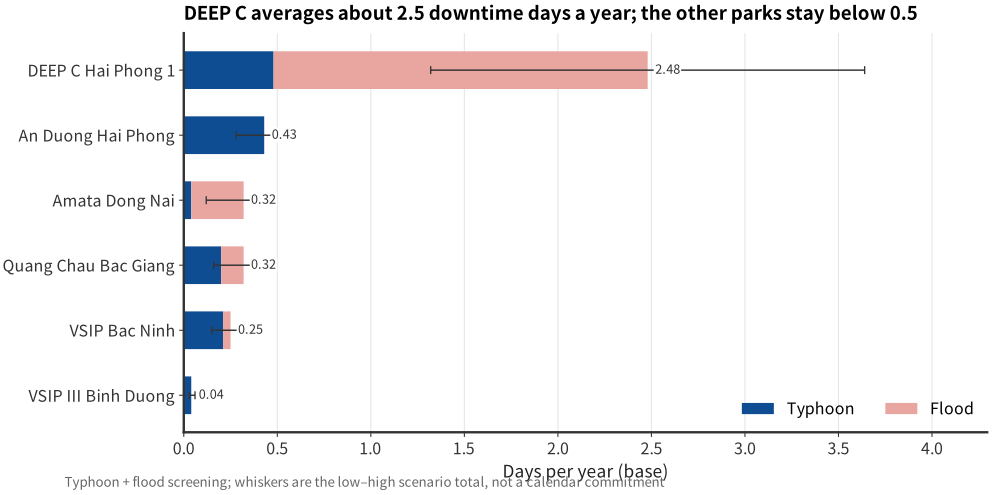
Terms: annual downtime = trigger frequency × assumed closure days; whiskers = low/high scenarios; not a calendar commitment.
Source and nature: event frequency is CLIMADA model output; thresholds and days are report assumptions; A02–A05, A08.
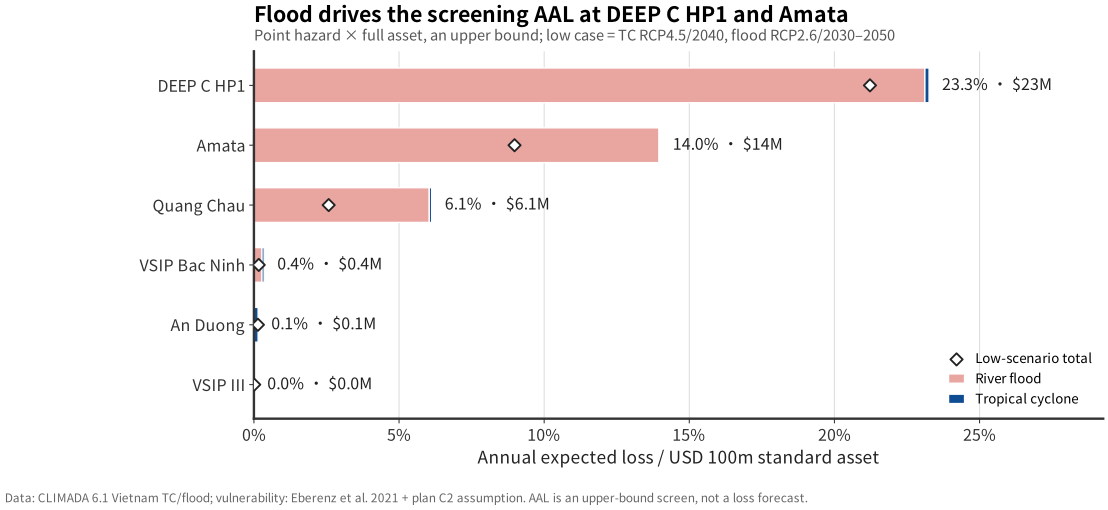
Terms: AAL = event loss weighted by annual frequency; low case = TC RCP4.5, flood RCP2.6; standard asset USD 100m.
Source and nature: AAL is model output; standard asset and flood curve are report assumptions; A01, A06–A08.
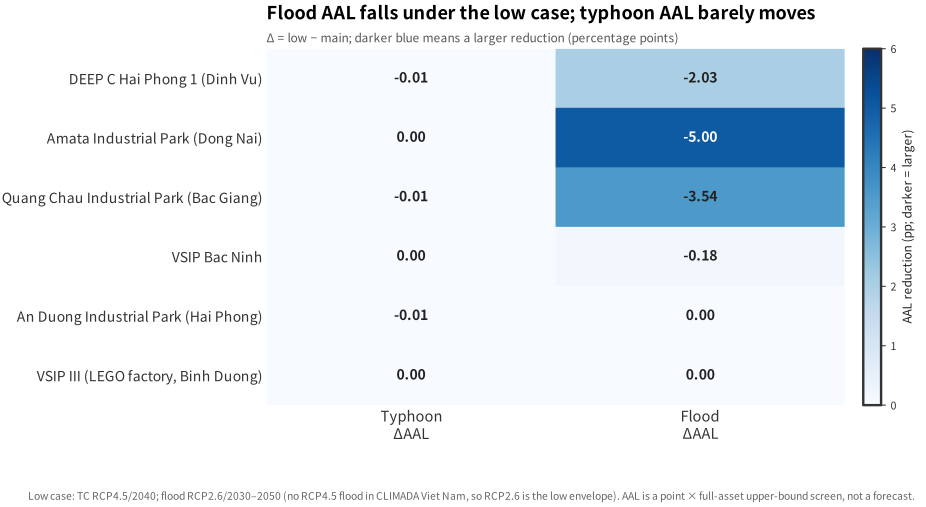
Terms: ΔAAL = low-case change vs base; darker blue = larger reduction; the flood low case is an RCP2.6 envelope, not RCP4.5.
Source and nature: CLIMADA model output; RCP8.5/2040, RCP4.5/2040 and RCP2.6 flood envelope; A09–A10.
| Park | Area | Developer / tenants | Power and water (to verify) | Two-hazard AAL |
|---|---|---|---|---|
| DEEP C Hai Phong 1 | 541 ha | DEEP C; LG, Bridgestone, Pegatron and others; 180+ firms in the cluster | Park-level supply; dual feed/backup capacity to confirm; coastal intake has salinity risk | 23.26% |
| Amata Dong Nai | 700 ha | Amata / Sonadezi; 190+ firms | Park supply; Dong Nai river/groundwater; dry-season volume and quality to confirm | 13.98% |
| Quang Chau Bac Giang | 426 ha | Kinh Bac City; Foxconn 50.5 ha MOU, Luxshare 29.1 ha project | Park supply; Cau/Red River plain; dry-season flow and waterlogging to confirm | 6.12% |
| VSIP Bac Ninh | 635 ha | VSIP; electronics and precision manufacturing | Park supply; Red River plain; dry-season volume to confirm | 0.35% |
| An Duong Hai Phong | 196 ha | Shenzhen Investment Holdings / Hai Phong; electronics, machinery, garments | Park supply; surface/groundwater in the Red River delta to confirm | 0.14% |
| VSIP III Binh Duong | 1,000 ha | VSIP; LEGO 44 ha / $1.3B, production from 2025 | Project page cites 220 kV supply and wastewater treatment; dual feed to confirm | 0.01% |
Flood AAL is not a site survey: the maximum flood AAL comes from the nearest river-grid point, not a park-boundary maximum. Amata 6.5 m and QL5B 6.0 m are point-depth screening values. Before any retrofit or capex ranking, verify park elevation, drainage capacity and the 2024 actual ponding record.
Section takeaway
- Judgment: under one standard asset and an upper-bound vulnerability assumption, flood AAL drives the park ranking: DEEP C 23.3%, Amata 14.0%, Quang Chau 6.1%. Bac Ninh/Bac Giang have the highest power score but power is not monetised. Low AAL in the two southern parks does not mean low heat, waterlogging or water-supply risk.
- Evidence: CLIMADA typhoon/flood event sets, the Eberenz (2021) South East Asia typhoon curve, the five-point flood assumption and a USD 100m standard asset; park profiles from official pages and OSM.
- Action: verify elevation, drainage and 2024 ponding at DEEP C and Amata first; assess low-capex power and water measures at Bac Ninh/Bac Giang; do not turn a river-point AAL directly into a large flood-defence investment.
- Triggers to revisit: if site elevation, drainage or 2024 records differ materially from the point values, AAL and the ranking must be recalculated.
03 / LOGISTICS
Logistics corridor: annualised disruption screening at five nodes
On the Friendship Pass–Bac Ninh–Hai Phong corridor, Dinh Vu bridge and QL5B have the highest flood screening values; the mountain QL1A section and Dong Dang gate are more exposed to wind closure. The 1–3 day road/bridge closure, 32.7 m/s and 0.3 m thresholds are planning assumptions, not verified operating rules.
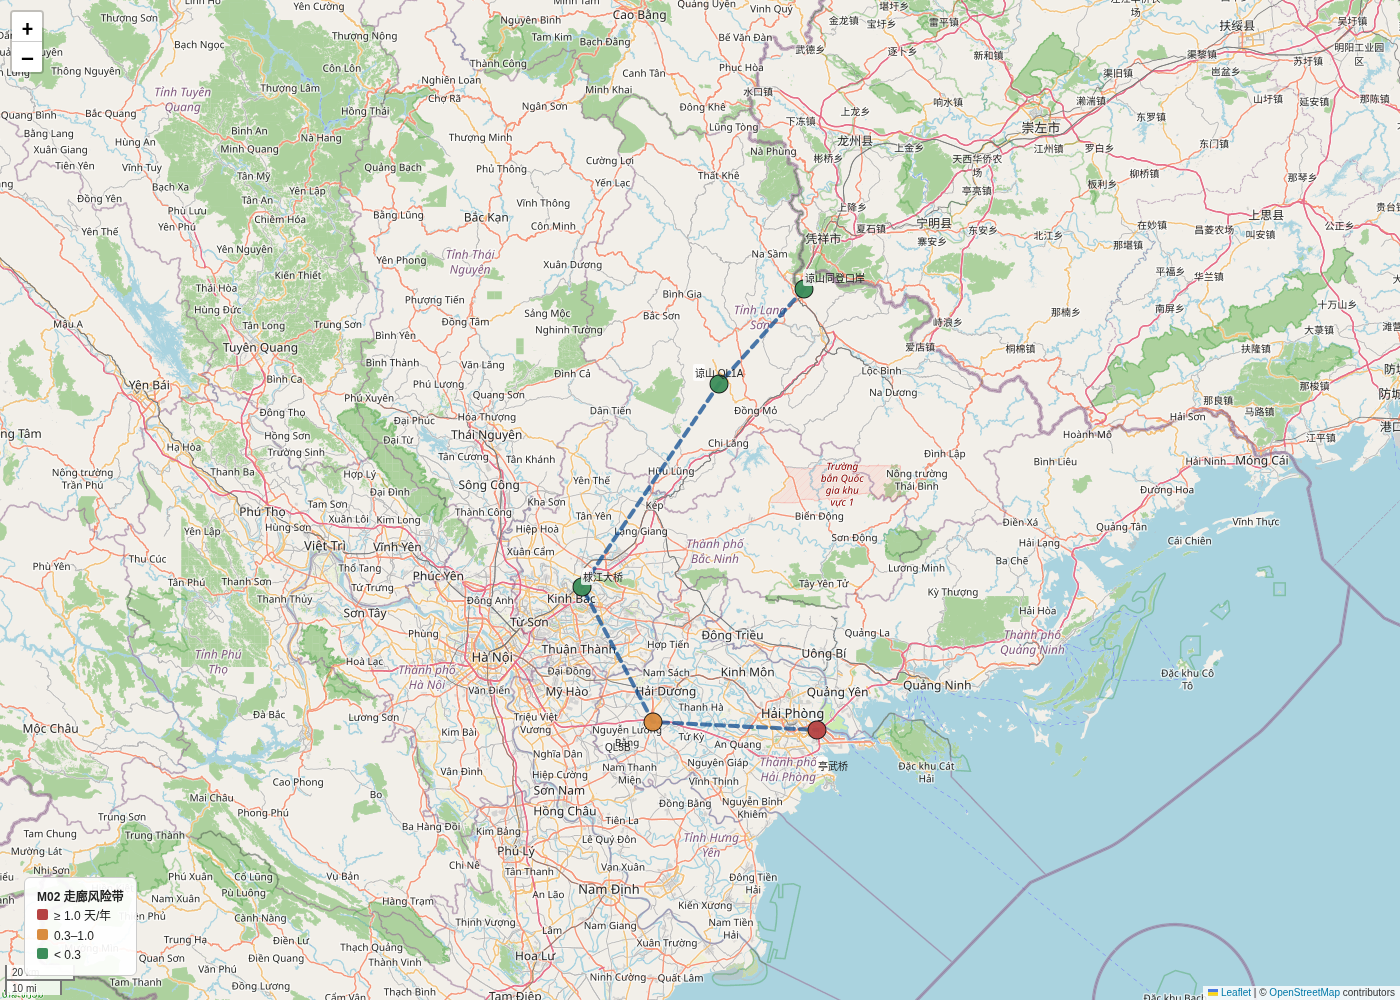
Terms: annual disruption days = wind/flood trigger probability × assumed closure days; colour ranks nodes, not passage probability.
Source and nature: model frequency × report assumption; coordinates from OSM/official park pages; A02–A05, A08, A16.
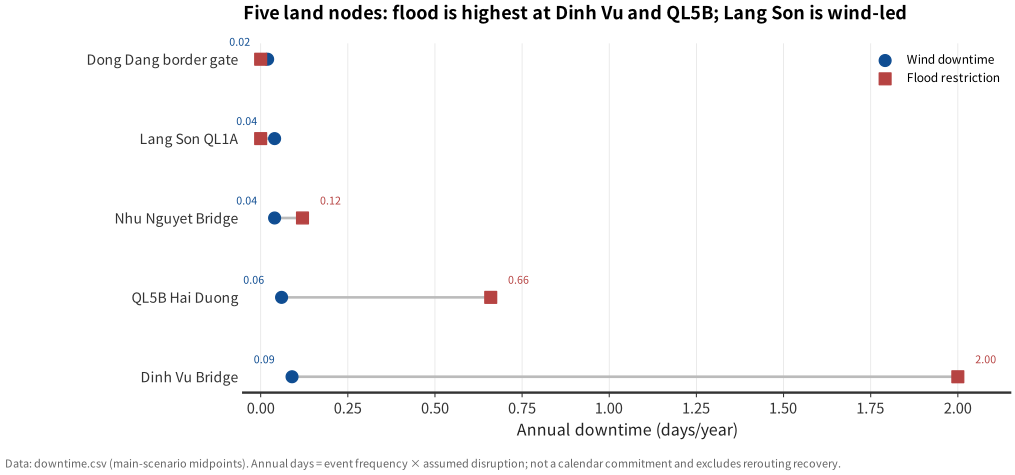
Terms: dumbbell compares wind and flood annual days for the same node; the definitions differ, so do not add them.
Source and nature: model frequency × report assumption; A02–A05, A08, A16.
| Node | Type | Yagi peak wind | Maximum flood depth | Screening meaning |
|---|---|---|---|---|
| Dong Dang gate | Border yard | 28.23 m/s | 0.00 m | Below the stop-work line; customs and mountain recovery time are the main uncertainty |
| Lang Son QL1A | Mountain road | 34.25 m/s | 0.00 m | Above 32.7 m/s; slope and closure duration not modelled |
| Cau River bridge | Bridge | 44.90 m/s | 3.71 m | Wind and flood trigger together; deck access needs site verification |
| QL5B Hai Duong | Trunk road | 34.47 m/s | 5.98 m | Highest flood screening value; links Hai Phong port with Bac Ninh/Bac Giang |
| Dinh Vu sea bridge | Bridge | 45.15 m/s | 1.34 m | Wind closure and port closure may overlap |
Section takeaway
- Judgment: logistics screening risk is concentrated at two nodes: Dinh Vu bridge 1.85 days/year (0.92–2.78) and QL5B Hai Duong 0.66 (0.33–0.99); Cau River bridge 0.12. Wind closure days are generally lower than flood, but mountain and border recovery takes longer.
- Evidence: 13-node event table, the 0.3 m flood restriction line, the 32.7 m/s wind threshold and a 1–3 day closure assumption; these are planning metrics, not verified operating rules.
- Action: set separate triggers and alternative routes for Dinh Vu/QL5B flood and Lang Son wind; write closure notice, inventory buffer and alternative supplier into contracts rather than relying on historical average downtime.
- Triggers to revisit: actual road/port closure records, queue build-up or bridge weight/height limits would change the corridor priority. Freight volume, inventory and alternative routes are not modelled.
04 / COST-BENEFIT
Base case: portfolio 10-year NPV ≈ +$86M, but positive NPV is concentrated in three parks
Three schemes use USD 100m standard assets, 5%–8% capex and 28%–52% AAL reduction. DEEP C, Amata and Quang Chau are positive; Bac Ninh, An Duong and VSIP III are negative in the base case. That does not mean “do not invest”; it means the standard package is the wrong package.
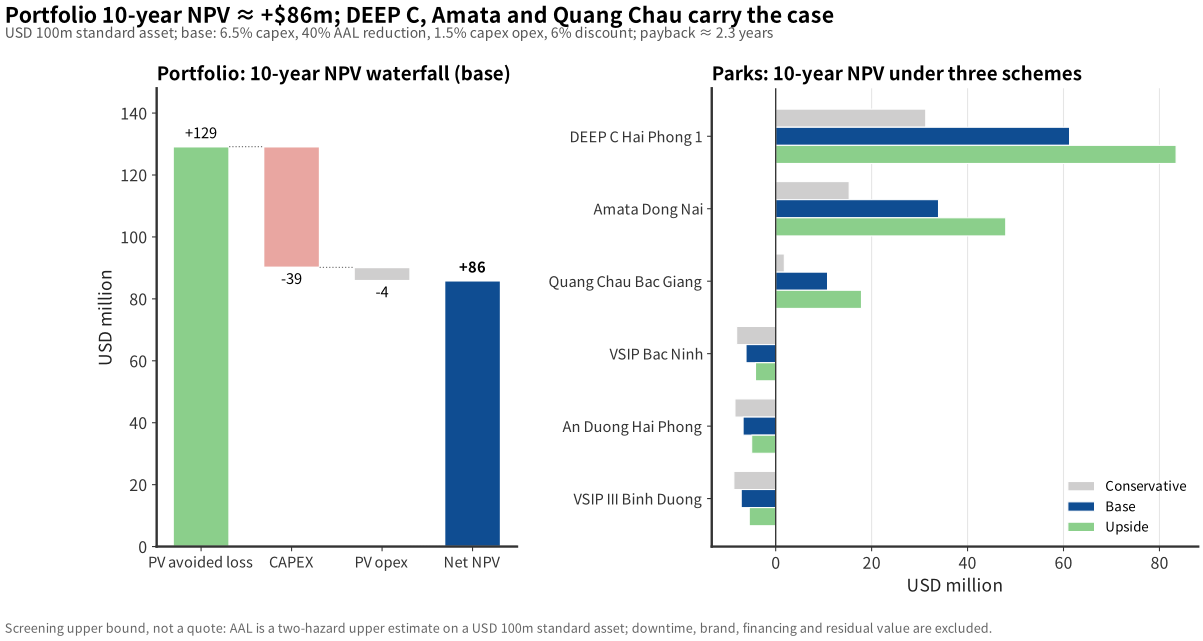
Terms: NPV = PV of avoided loss − capex − opex; capex is 5%–8% of asset; payback is undiscounted and over 10 years is shown as “no payback”.
Source and nature: report assumptions (standard asset, capex, AAL reduction, discount rate), not a client quote; A01, A13.
| Assumption | Value | Note |
|---|---|---|
| Standard asset | $100M / park | Not a client valuation; used for comparison |
| CAPEX | 5%–8% | Three cases: 8% / 6.5% / 5% |
| AAL reduction | 28%–52% | Base 40%, ±30% sensitivity |
| Annual opex | 1.5% of capex | Excludes major overhaul and replacement |
| Discount / horizon | 6% / 10 years | Conservative case 10% |
How to read it
- DEEP C: base NPV +$61M, payback about 0.7 years; flood AAL is the main benefit source and must be verified with site elevation and drainage.
- Amata / Quang Chau: +$34M / +$11M; Quang Chau remains positive in the conservative case, with about a 5-year payback.
- Bac Ninh / An Duong / VSIP III: the standard package is negative; use smaller measures such as power, water and local drainage instead.
Not a quote: ROI is a screening upper bound, not an engineering study. AAL is calculated on “USD 100m standard asset + two upper-bound hazard curves”; it excludes downtime, brand, financing, residual value and insurance. Positive NPV means “worth diligence”, not “invest now”.
| Check | Current treatment | If different, what changes |
|---|---|---|
| Park elevation and drainage | Nearest river-grid point; Amata 6.5 m, Quang Chau 5.0 m | If actual ponding is much lower, DEEP C/Amata flood AAL and NPV fall; ranking may change |
| Dual feed and backup capacity | Not site-verified; 1–5 rubric only | If capacity is insufficient, power/water measures move up; the standard flood package is no longer the main option |
| Actual road/bridge closures | 1–3 days per wind event assumption | If history is shorter or longer, F06 logistics priority and insurance planning need recalculation |
| Client book value | USD 100m standard asset | NPV scales roughly linearly with asset value, but park ranking still needs one consistent basis |
Section takeaway
- Judgment: under base assumptions, the six-park 10-year NPV is about +$85.9M, but positive NPV is concentrated in DEEP C (+$61.3M), Amata (+$33.9M) and Quang Chau (+$10.8M); the standard package is negative for VSIP Bac Ninh, An Duong and VSIP III.
- Evidence: USD 100m standard asset, 5%–8% capex, 28%–52% AAL reduction, 10 years, 6% discount (10% conservative). AAL is an upper bound; NPV excludes downtime, brand, financing, residual value and insurance.
- Action: advance the DEEP C, Amata and Quang Chau packages; start with smaller power, water and local drainage measures at Bac Ninh, An Duong and VSIP III. Complete three site checks before any capex and replace the 5%–8% assumption with actual quotes.
- Triggers to revisit: lower site flood AAL, capex above 8% or AAL reduction below 28% would narrow positive NPV. Negative-NPV parks should evaluate smaller measures before rejecting investment.
05 / CONCLUSIONS
Report conclusions
Taken together, the data support four conditional judgments. They set priorities for ranking, stress testing and site verification; they are not a loss forecast, insurance price or investment recommendation.
Flood AAL is the first driver of park ranking
On a USD 100m standard asset and upper-bound vulnerability, DEEP C 23.3%, Amata 14.0%, Quang Chau 6.1%; Bac Ninh/Bac Giang have the highest power score but power is not monetised. Low AAL in the two southern parks does not mean low heat, waterlogging or water-supply risk.
Basis: CLIMADA typhoon/flood event sets + regional typhoon curve + five-point flood assumption; point values are not park-boundary maxima.
Positive NPV covers only three parks
Base-case 10-year portfolio NPV is about +$85.9M, concentrated in DEEP C (+$61.3M), Amata (+$33.9M) and Quang Chau (+$10.8M). The standard package is negative for Bac Ninh, An Duong and VSIP III; start with power, water and local drainage measures.
Basis: 5%–8% capex, 28%–52% AAL reduction, 10 years, 6% discount; not a quote or engineering study.
2026–27 ENSO is a watch layer, not a loss forecast
Northern parks are more likely to face curtailment, water-intake limits and higher cooling load; southern parks face heat, water intake and low flow; ports and land transport face typhoon-season-tail closure and delivery delay. ENSO does not enter AAL and does not remove single-event typhoon or extreme-rain risk.
Basis: NOAA CPC, WMO, UNICEF Viet Nam SitRep 2 and Vietnam News; all are observations or seasonal forecasts.
Three site checks cannot be skipped before capex
First, park elevation, drainage and 2024 actual ponding; second, dual feed and backup capacity; third, actual road/bridge closure records and alternative routes. If any differs from the assumption, AAL, NPV or ranking may change.
The current conclusion is screening-level; site verification, independent due diligence and formal engineering assessment should precede capex.
Strength of conclusions: these are conditional judgments, not promised loss, budget or investment return. All values depend on the asset basis, point representation, vulnerability curve and scenario assumptions; they hold only under the stated scenario, unit and source.
06 / GLOSSARY
Terms used in the charts and tables
These definitions explain the figures and captions. Numbers remain governed by the relevant caption, unit and scenario. Definitions do not replace site verification.
AAL · annual average loss
For each event, multiply frequency by loss, then sum across events. This report is an upper-bound screen for two hazards on a USD 100m standard asset; it is not accounting loss or insurance pricing.
CAPEX · capital expenditure
One-off retrofit spending. Assumed at 5%–8% of the standard asset; excludes land, downtime and financing cost.
NPV · net present value
Future net benefits discounted to today minus initial capex. Discount rate 6% (10% in the conservative case).
RCP · representative concentration pathway
A climate-scenario label, not a forecast. Main RCP8.5/2040, control RCP4.5/2040; the flood low case uses RCP2.6/2030–2050 because the CLIMADA Vietnam flood set has no RCP4.5.
Main / low scenario
Main supports the report conclusion; low shows a range. Low is not “more likely” and is not a commitment.
0.05° / 150 arcsec
Grid resolution. 0.05° is about 5.5 km; 150 arcsec about 4.6 km. A node uses the nearest grid point, not a park-boundary maximum.
ENSO / Niño-3.4
ENSO is the El Niño–Southern Oscillation; Niño-3.4 is the central/eastern equatorial Pacific SST anomaly index. Used only as a 2026–27 near-term watch, not monetised.
OND / JFM
OND = October–December; JFM = January–March of the following year. ENSO uses seasonal means, not daily forecasts.
H08 · wind-field parameterisation
A CLIMADA tropical-cyclone wind model that converts track maximum wind and wind radii into grid wind. It is a model, not an observation.
IBTrACS · best track
International best-track archive of historical typhoon position, intensity and wind radii. Used to reconstruct the northern Vietnam wind field for Yagi.
Peak wind
Maximum wind at the nearest grid point during one event, in m/s. It is a single-event sample, not a return-period wind or maximum possible event.
Impact function / vulnerability curve
A function mapping hazard intensity to asset damage ratio. The typhoon curve is the Eberenz et al. (2021) South East Asia calibration; the flood curve is this report's five-point assumption and is not calibrated to park elevation.
Exposure
Assets, capacity or nodes within the hazard footprint. Exposure alone is not loss; loss also requires vulnerability and event frequency.
32.7 / 24.5 m/s · 0.3 m
32.7 m/s is the lower bound of Beaufort 12 and 24.5 m/s of Beaufort 10 (NOAA WPC); using them as park/land stop-work and port closure lines is a report assumption. 0.3 m refers to Hanoi's “close/divert roads when ponding exceeds 30 cm” road-emergency reference; applying it to all nodes is a screening extrapolation, not a park/port statutory standard. Actual practice follows operator notices, leases and site SOPs. See A02–A04.
Annual disruption days
Event frequency × assumed stop-work/restriction days. Not an actual calendar record or a promise of days lost each year.
Power risk score 1–5
Relative risk ranking, not outage probability. The rubric considers 2023 curtailment, supply mix, backup power and the ENSO stress window.
Point screening
Using the nearest grid point to represent a park or road section. Suitable for ranking, not for a single building or plot loss.
Standard asset
A common USD 100m assumption per park for comparison; not client book value and not a replacement-cost quote.
Upper-bound screen
Applies node intensity to the full standard asset without subtracting drainage, flood defences, backup power or shutdown behaviour. It answers “how bad could it be”, not “how much will we lose this year”.
ΔAAL
Change in AAL in the low case relative to the main case. A negative value means lower loss in the low case; it is not a promised loss reduction.
Payback
Undiscounted years to recover capex. Over 10 years is shown as “no payback”; that does not by itself mean the project is loss-making.
07 / METHOD AND LIMITS
Data, formulas and limits are traceable
The main text gives judgments; method, assumptions and limits sit here and in the appendix. Scenarios are not forecasts, AAL is not a budget, and maps are not engineering siting documents. All datasets and HTML documents are in 08 Data.
Nature of the data: the report separates observations, model output, public information and report assumptions; not every number is observed. Numbered assumptions, external sources and limits are in Assumptions A01–A16 and the source log. Chart-level data nature is indexed in 08 Data.
Data
IBTrACS single event, CLIMADA Vietnam TC/flood sets, OSM park coordinates, public park profiles, NOAA/WMO/UNICEF/Vietnam News.
IBTrACSCLIMADA 6.1OSMENSO
Model
H08 wind field; CLIMADA regional typhoon curve (South East Asia); five-point flood curve; AAL = Σ(frequency × asset × damage ratio); transparent pandas NPV.
0.05°RCP8.5/2040RCP4.5/2040RCP2.6 low case
Limits
Flood uses the nearest grid point, not a park-boundary maximum; power is a 1–5 rubric, not outage probability; 1–3 day road closure is an assumption; ENSO is not monetised.
not a forecastnot a quotenot engineering siting
Formula: AALp = Σe fe × Lp(e); NPV = −CAPEX + Σt=1..10 (annual net benefit / (1+r)t). Here fe is annual event frequency, Lp(e) is loss at park p, and r is the discount rate.
08 / DATA AND SOURCES
Data tables, documents and the 13-node master table
All documents are HTML reading versions. Raw CSV and Markdown downloads are not provided, so figures are not quoted out of context. Datasets are placed at the end so they do not interrupt the narrative.
Chart and data source index
| Chart | Data nature | Source / assumption | Do not use as |
|---|---|---|---|
| F01 Yagi wind field | Observed track + modelled wind | IBTrACS SRC-IBTRACS-001; CLIMADA H08; A15 | Not node observation or return period |
| F02 13-node intensity | Model + report threshold | IBTrACS/H08; CLIMADA river_flood; A02–A04, A09–A10, A14 | Point values are not park-boundary maxima |
| F03 park heatmap | Model + rubric | AAL A01/A06–A08; power A12; logistics A05 | Index is not probability |
| F04 park AAL | Model + report assumption | CLIMADA event sets; Eberenz 2021; A01, A06–A08 | Not a loss forecast or insurance price |
| F05 annual downtime | Model frequency × assumption | CLIMADA; A02–A05, A08 | Not a calendar commitment |
| F06 logistics nodes | Model frequency × assumption | CLIMADA; A02–A05, A08, A16 | Wind and flood days are not additive |
| F07 10-year NPV | Report assumption | A01, A13; no client quote | Not engineering study or investment advice |
| F08 scenario matrix | Model output | A09–A10; CLIMADA RCP sets | ΔAAL is not a promised reduction |
| F09 ENSO watch | Observation + seasonal forecast + interpretation | NOAA CPC, WMO, UNICEF, Vietnam News; A11 | Not a loss forecast; never added to 2040 |
| M01 / M02 | Observed track + public coordinates + modelled disruption | IBTrACS, OSM, official park pages; A05, A14, A16 | Not an engineering siting map |
Full parameters, data nature and source IDs: Assumptions A01–A16; external sources: source log. “Model” is not observation; “report assumption” is not an external standard.
Data tables
Documents
| Node | Type | Yagi peak wind | Maximum flood depth | Above line? | Note |
|---|---|---|---|---|---|
| DEEP C Hai Phong 1 | Park | 44.70 m/s | 1.34 m | Wind + flood | Dinh Vu area; flood is nearest grid point |
| An Duong Hai Phong | Park | 43.07 m/s | 0.00 m | Wind | Red River delta |
| VSIP Bac Ninh | Park | 42.32 m/s | 0.37 m | Wind + flood | Electronics / precision manufacturing |
| Quang Chau Bac Giang | Park | 45.17 m/s | 5.05 m | Wind + flood | Foxconn / Luxshare supply chain |
| VSIP III Binh Duong | Park | 0.00 m/s | 0.00 m | No | Yagi did not track south; flood grid zero |
| Amata Dong Nai | Park | 0.00 m/s | 6.52 m | Flood | Highest flood point; verify site elevation |
| Lạch Huyện port | Port | 42.65 m/s | 0.00 m | Port line | Closure reference 24.5 m/s |
| Cái Mép port | Port | 0.00 m/s | 0.00 m | No | Southern port |
| Dong Dang gate | Border yard | 28.23 m/s | 0.00 m | No | Customs recovery time not modelled |
| Lang Son QL1A | Mountain road | 34.25 m/s | 0.00 m | Wind | Representative section, low confidence |
| Cau River bridge | Bridge | 44.90 m/s | 3.71 m | Wind + flood | Như Nguyệt bridge |
| QL5B Hai Duong | Trunk road | 34.47 m/s | 5.98 m | Wind + flood | Gia Lộc interchange |
| Dinh Vu bridge | Bridge | 45.15 m/s | 1.34 m | Wind + flood | Hai Phong port access |
Data nature and provenance: peak wind is the IBTrACS observed track passed through the H08 wind field (model output, not a node observation; A15). Maximum flood depth is the node maximum in the CLIMADA river_flood RCP8.5/2030–2050 event set (model output; data freeze). They are not the same return period and cannot be added. “Wind” means 32.7 m/s for parks/land or 24.5 m/s for ports; “flood” means 0.3 m. 32.7/24.5 m/s are Beaufort 12/10 lower bounds (NOAA WPC); 0.3 m refers to Hanoi's 30 cm road-closure reference; mapping them to park/port rules is a report assumption (A02–A04). Coordinates from OSM/official park pages; ports and land nodes are not monetised. Full source IDs: source log.